Bitcoin Fundamental & Technical Report
The crypto market bounced higher in the early hours this morning and is showing signs of a possible short term bottom. Volatility increased across all financial markets due to the highly anticipated FED interest rate decision, economic projections and policy statement.
Risk assets surged higher post FED announcement with the S&P500, NASDAQ and DOW jones running just shy of record-high territory. This move took place despite the FED accelerating the speed of its bond tapering program. The FED has doubled the pace of its bond tapering which should now end in early 2022, opening the doors for a number of interest rate hikes throughout next year. Generally, this news should have resulted in a negative decline across risk assets, a reduction of the money supply should lead to lower equity prices. However, Jerome Powell stated that the FED members have only just begun discussing when to start shrinking the central bank’s enormous balance sheet.
The FED has increased its balance sheet from $4 trillion (pre-pandemic) to $8.665 trillion – This number will continue rising until the QE program is complete mid 2022. Jerome Powell also stated that their approach to reducing the balance sheet will be different this time around and they are not sure when the runoff would start. Jerome Powell is referring to the balance sheet reduction back in 2018 when risk assets crashed across the board.
FED Balance Sheet

SP500 Weekly Chart

BTCUSD – Daily Chart
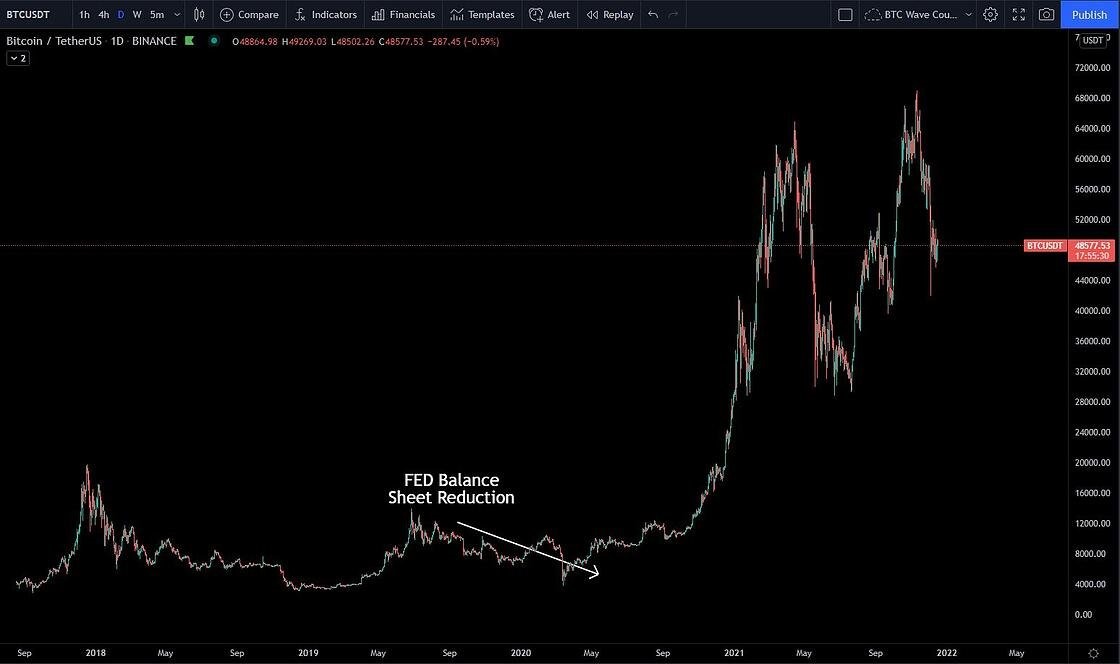
It will be no surprise that the FED’s balance sheet is having a large impact on a number of risk assets, even the crypto market. When the FED began shrinking its balance sheet back in 2018 both the crypto market and equity market moved significantly lower, we have highlighted the SP500 & BTCUSD decline back in 2018 in the charts above. The FED soon reversed course and their balance sheet exploded higher during the covid-19 pandemic, which push equities and cryptos to enormous valuations. Of course, there are also other factors in play that have helped push BTC towards the 70k resistance. However, moving forward watching the FED’s stance and actions towards reducing its balance sheet will be crucial.
The good news is, we are still in for another couple of months of increasing money supply, just at a slightly lower rate.
At the institutional level, there are extremely polarized opinions amongst investors, with some panic selling during this most recent price decline, while others see it as a buying opportunity. Despite some institutions reporting outflows up to 11% of funds under management, on an aggregate basis, Bitcoin saw inflows totalling US$51m.

ETH had the largest outflows on a weekly basis and the second largest on the monthly basis. Crypto investors appear to have reduced exposure to both DOT and ETH over the past month whilst BTC, SOL and TRON all had a large increase in fresh capital on a weekly and monthly basis despite the recent correction across most markets. Overall $87.8 million of fresh capital entered the market last week and $144 million over the past month.
We would need to be concerned if more institutional capital was leaving the market at these levels during this pullback.
BTC – Technical Analysis
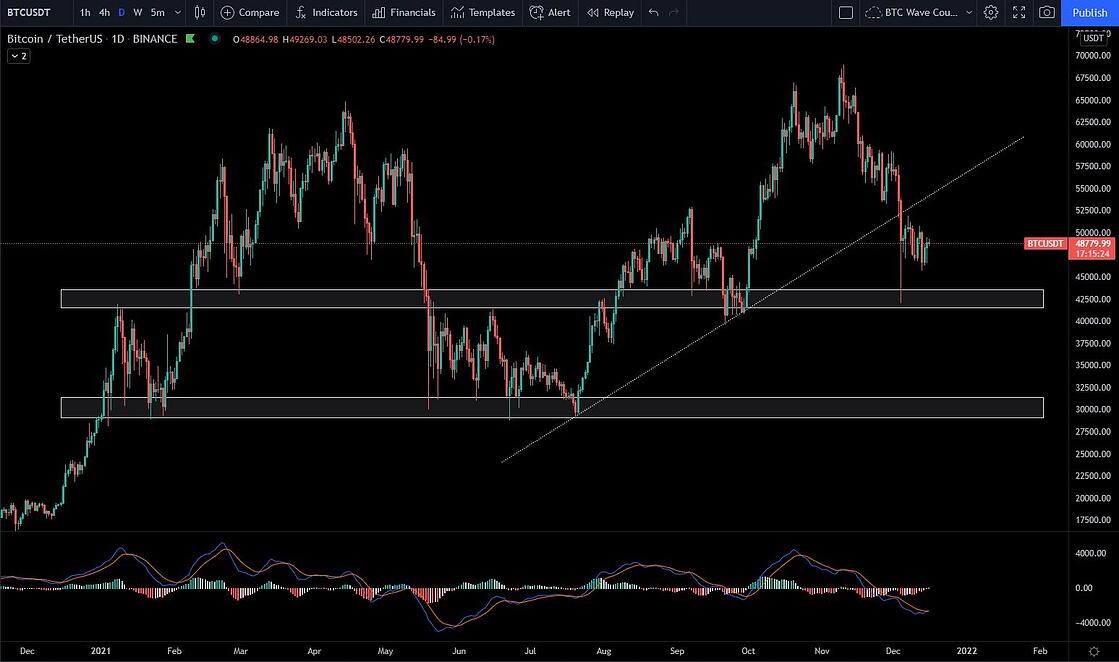
Technically speaking, BTC is holding the $42,000 support zone which was acting as resistance back in January 2021. As you can see, the technical breakdown from the rising trend line resulted in a sharp sell-off as investors unloaded positions and leveraged long trades became liquidated. We are expecting a period of consolidation at this level before the next big move in the market. MACD is beginning to turn bullish which is something to keep an eye on
That is all for now,
Kind regards,
Tony Fernandez
Head Market Analyst